
Where are your Apple Ads actually showing? (Free Tool!)
Introducing the NeoAds SOV Analyzer, a free tool to see where your Apple Ads actually show.

If you run Apple Search Ads, you’ve seen the Impression Share report.
You download the CSV. You open it in Excel. You start writing VLOOKUP formulas to cross-reference the All Positions report with the 1st Position report. You add a column, subtract, divide, format, and 20 minutes later you have a table that tells you roughly whether your ads are showing at the top or somewhere below.
As a previous account manager at Apple Ads, I’ve analysed thousands of these reports. I had a template, which was nice, but not very user friendly. And after a while, doing this manually for client after client, at some point I thought: this should just be a tool. So I built one.
If you’d told me a few years ago that I’d be able to build something like this so easily, I don’t think I’d have believed you. But here we are.
Introducing the NeoAds SOV Analyzer
Upload your two Apple Ads impression share exports - All Ad Positions and 1st Position - and the tool does everything automatically.
What you get in seconds:
Overview : how many search term / geo combinations are in 1st position, mainly 2nd, or low visibility
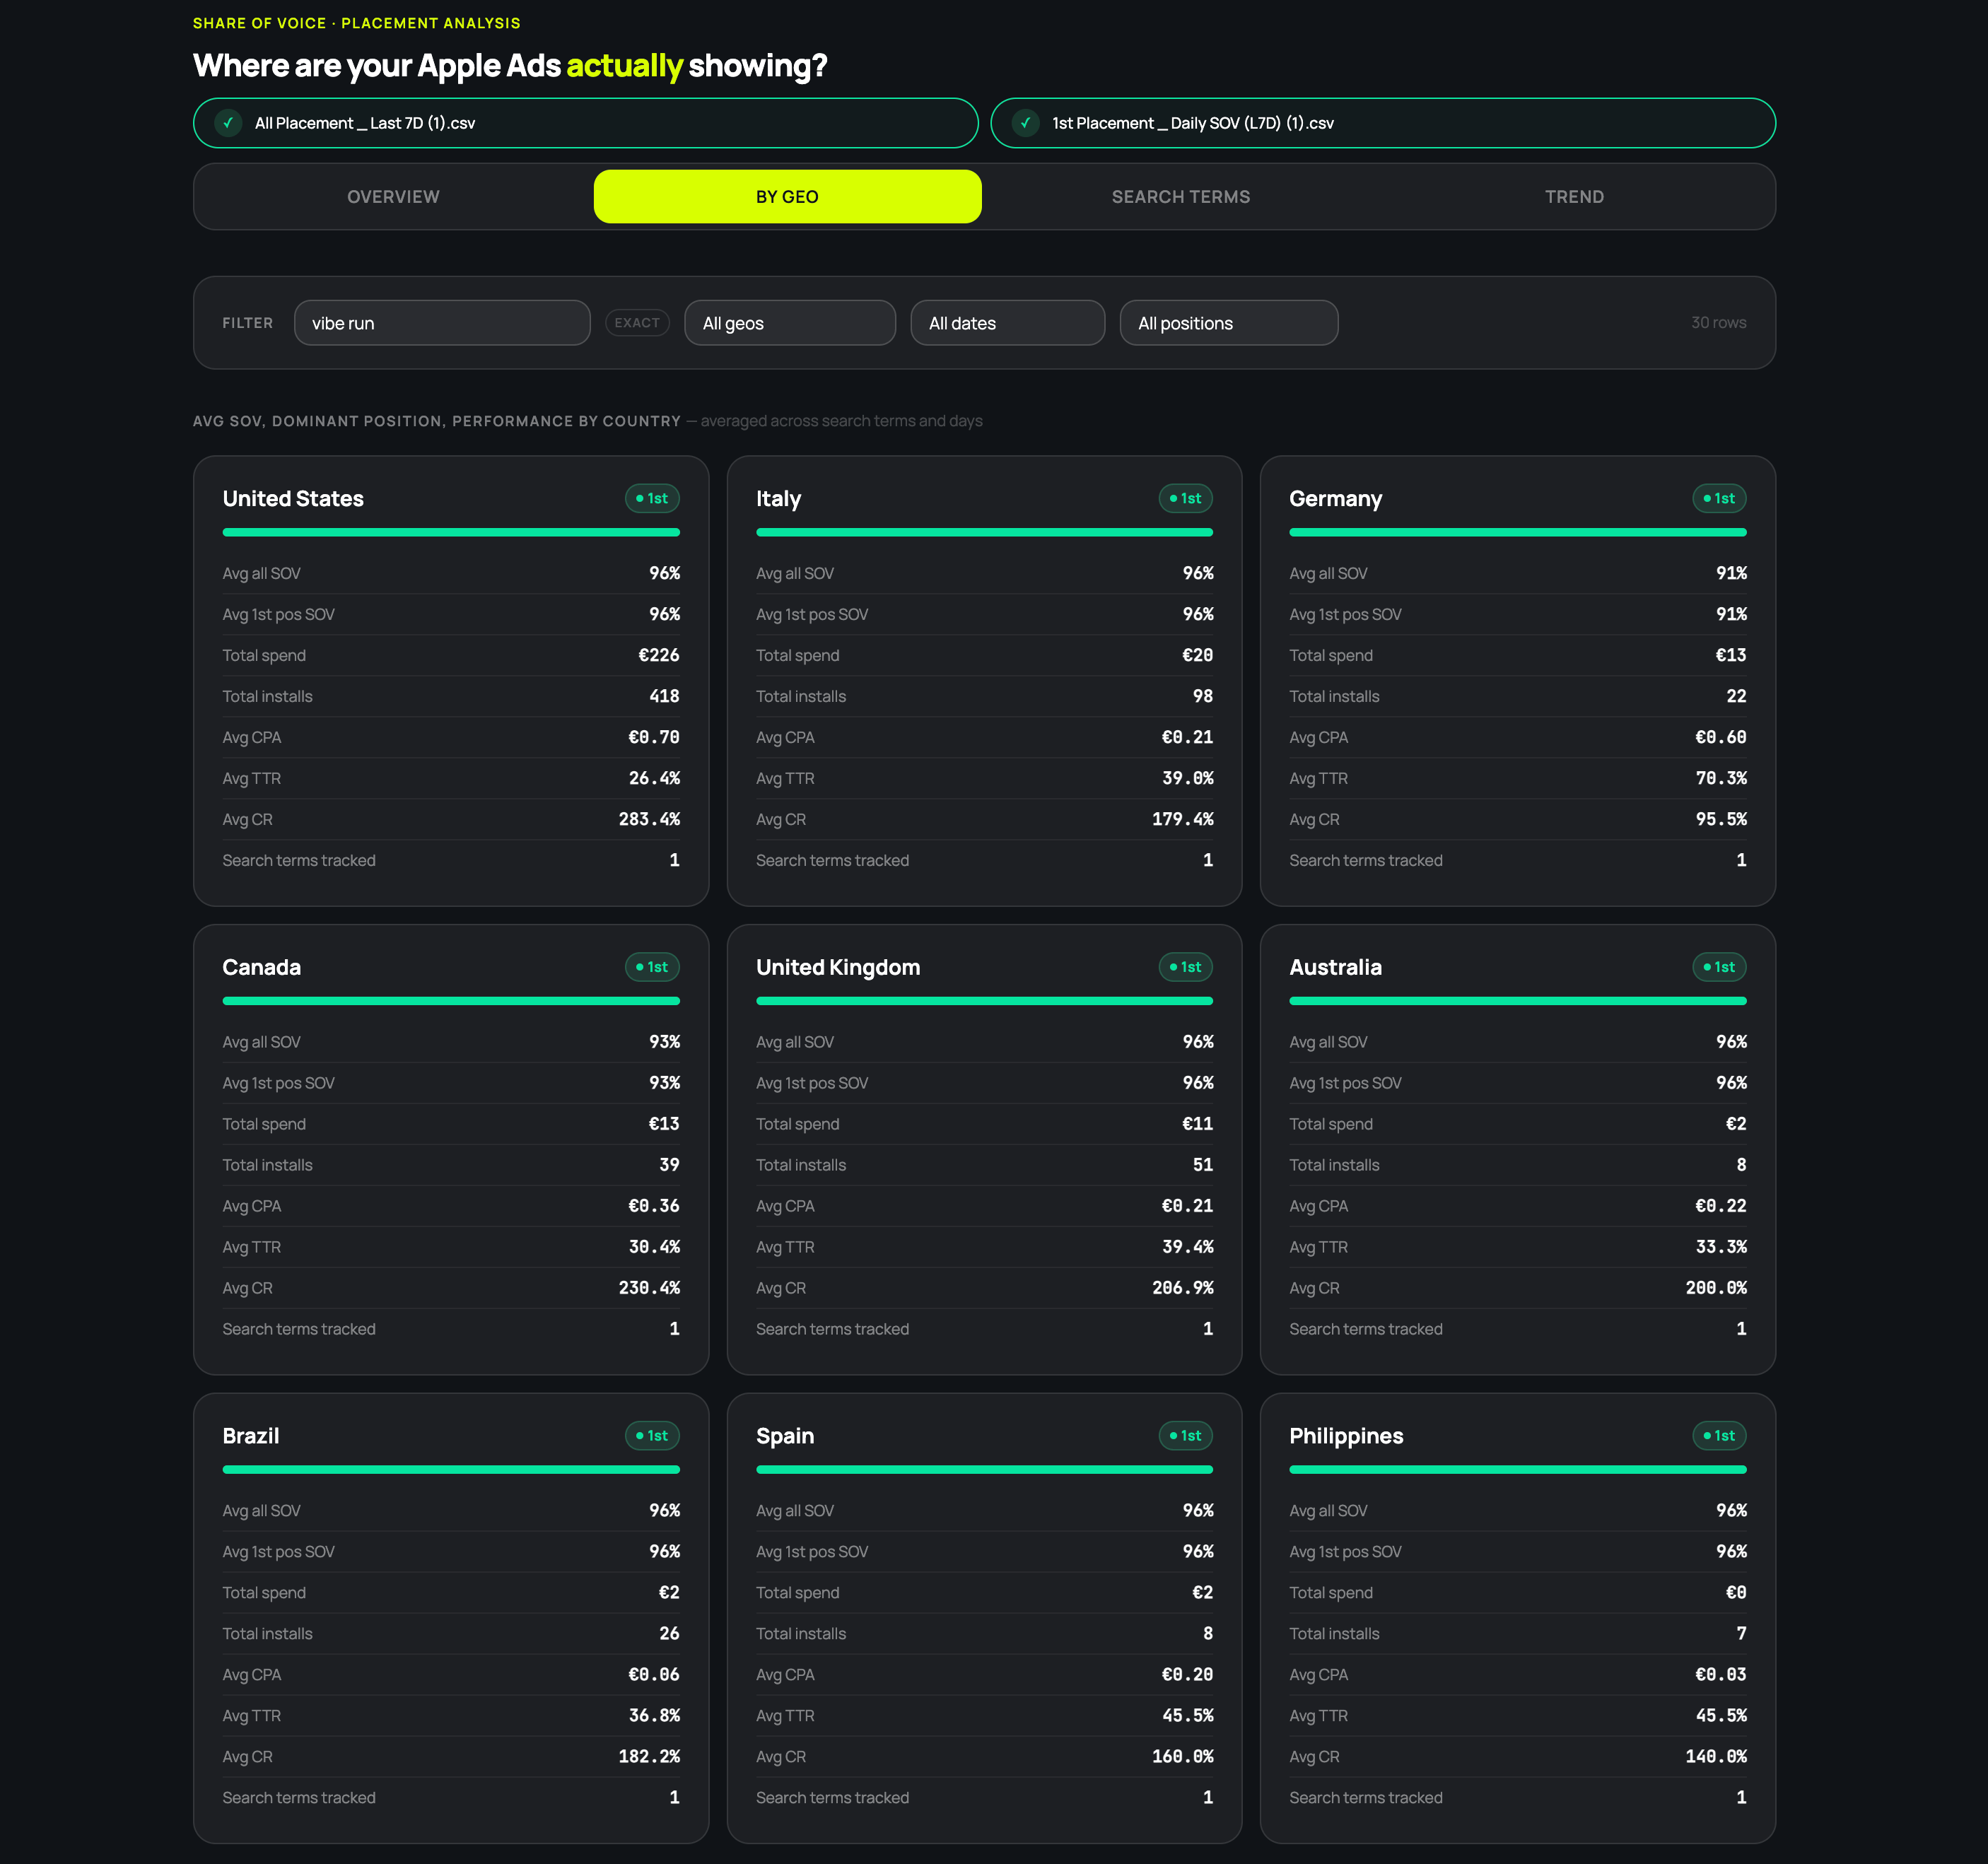
By Geo : SOV breakdown per market, so you immediately see where you’re dominant and where you’re bleeding
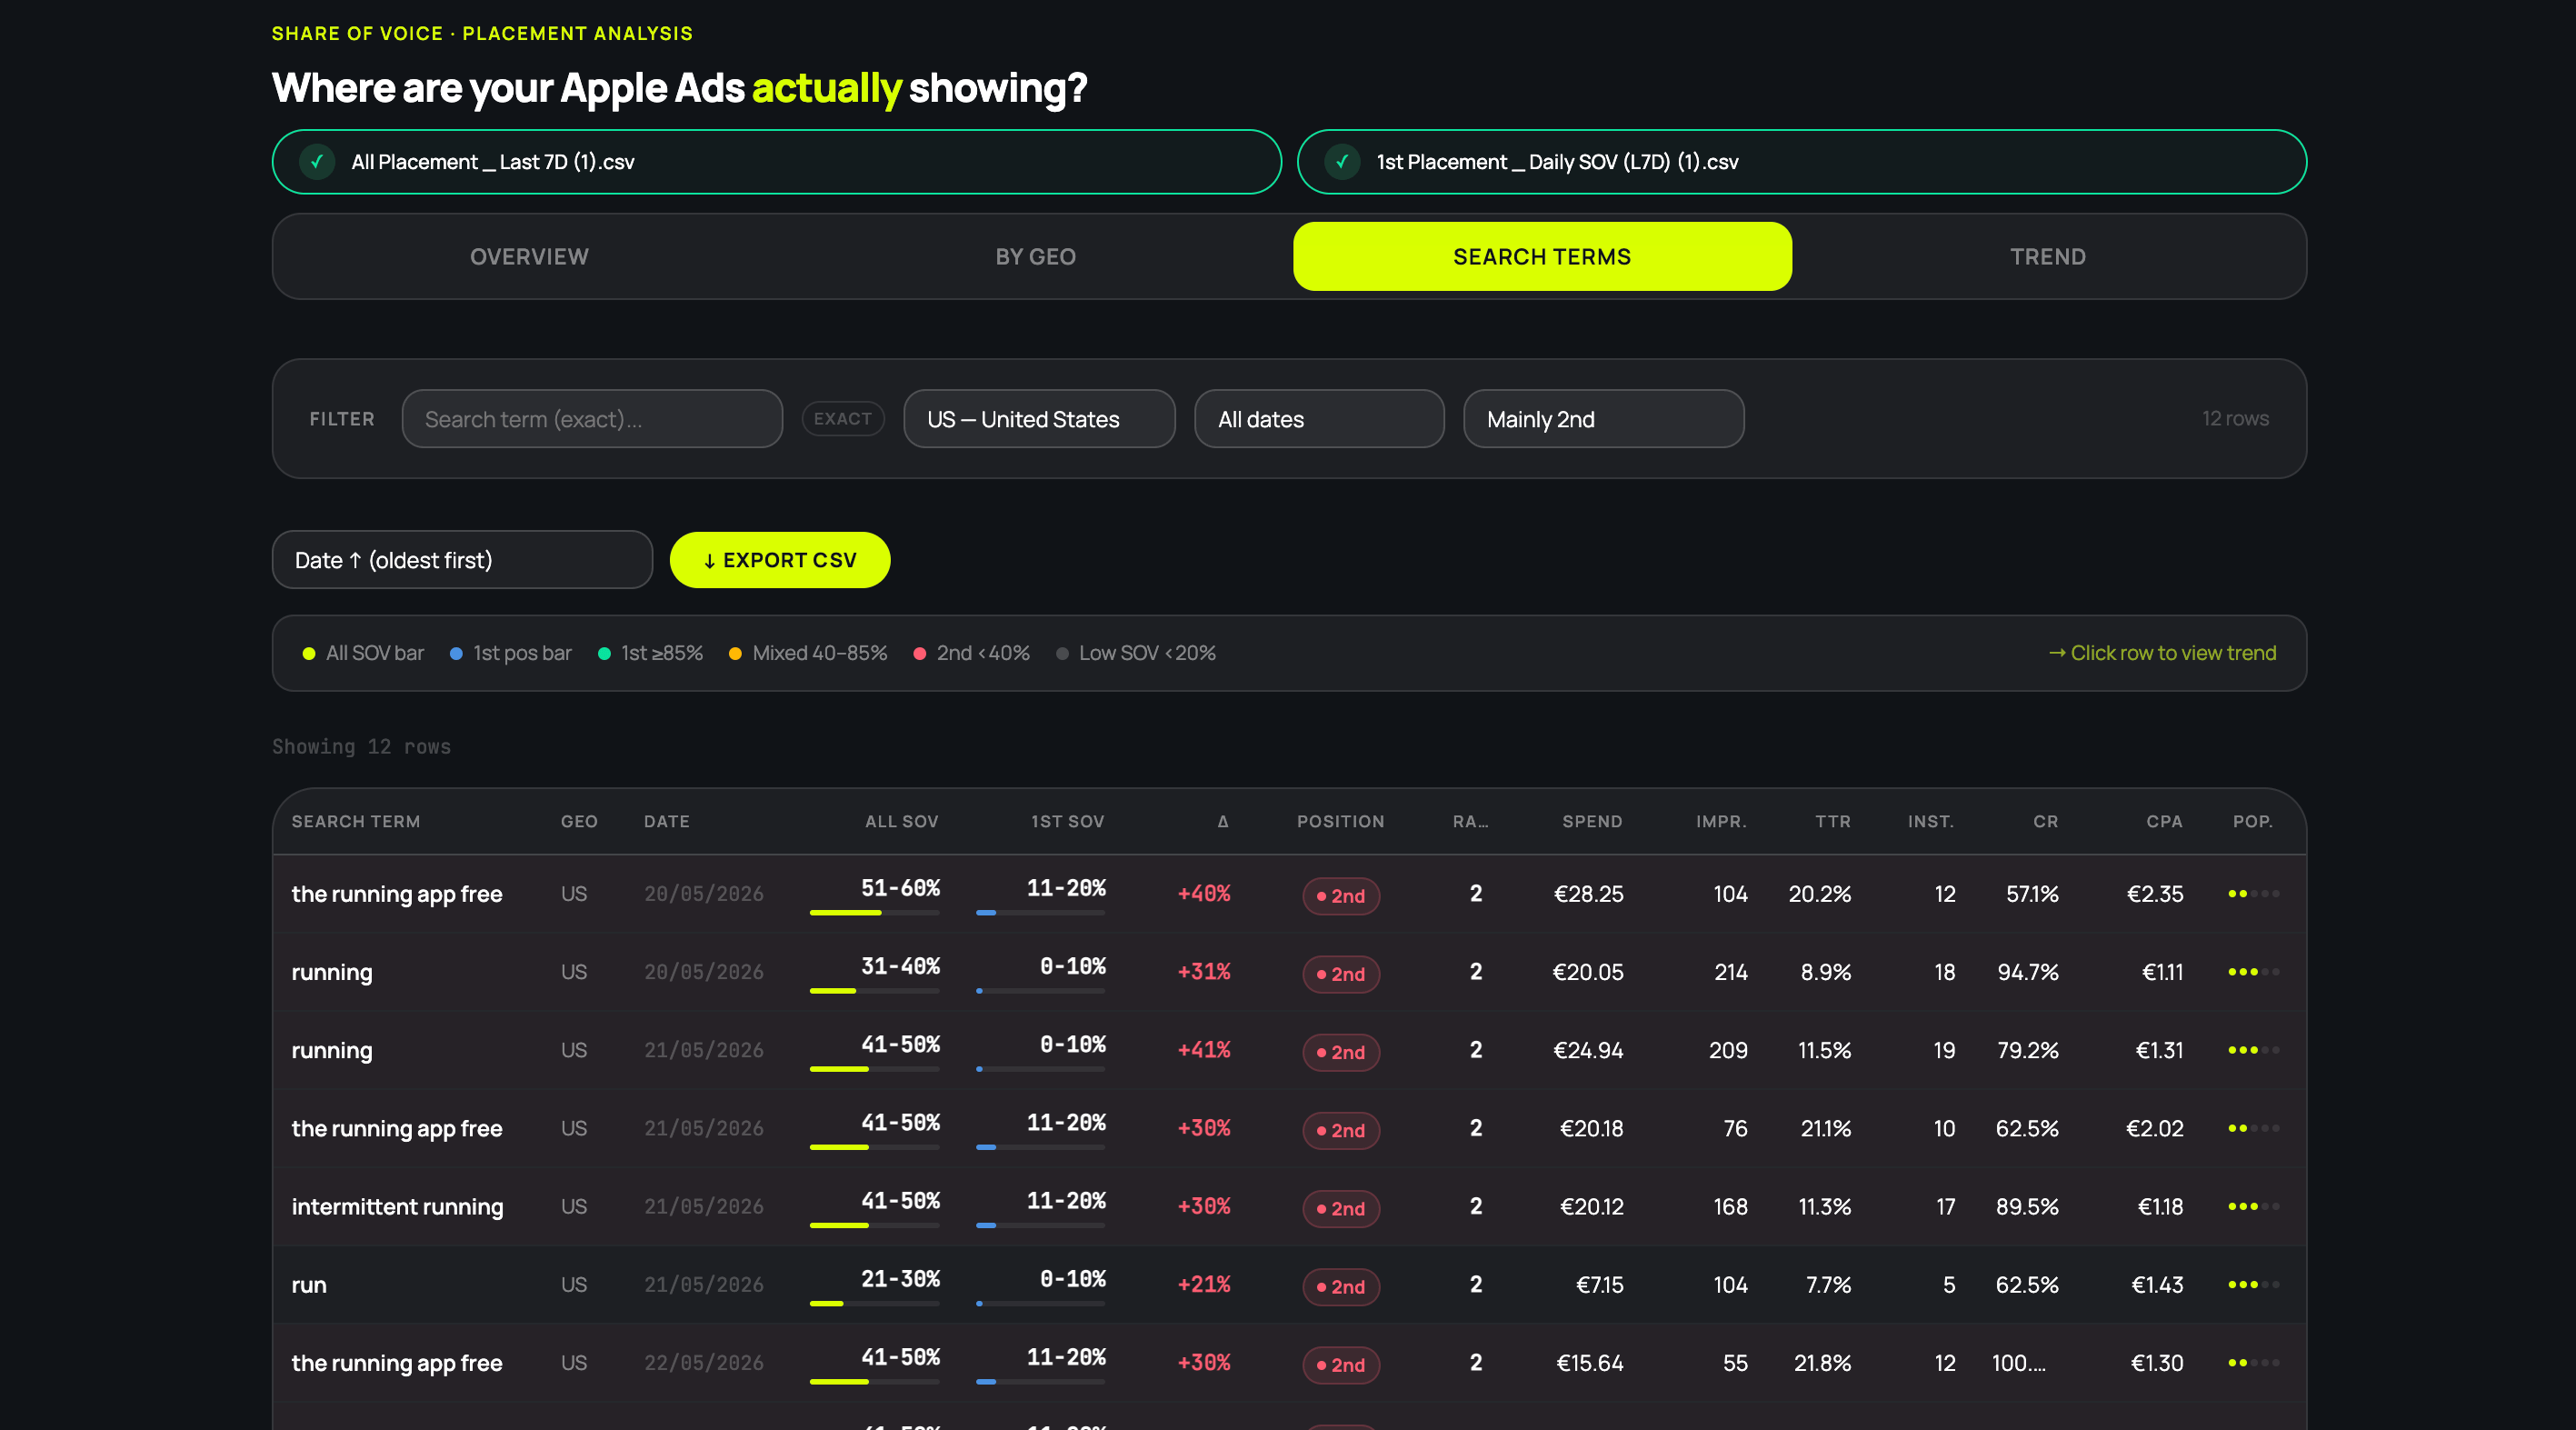
Search Terms : keyword-level table with All SOV %, 1st Position SOV %, position classification, TTR, CR, CPA
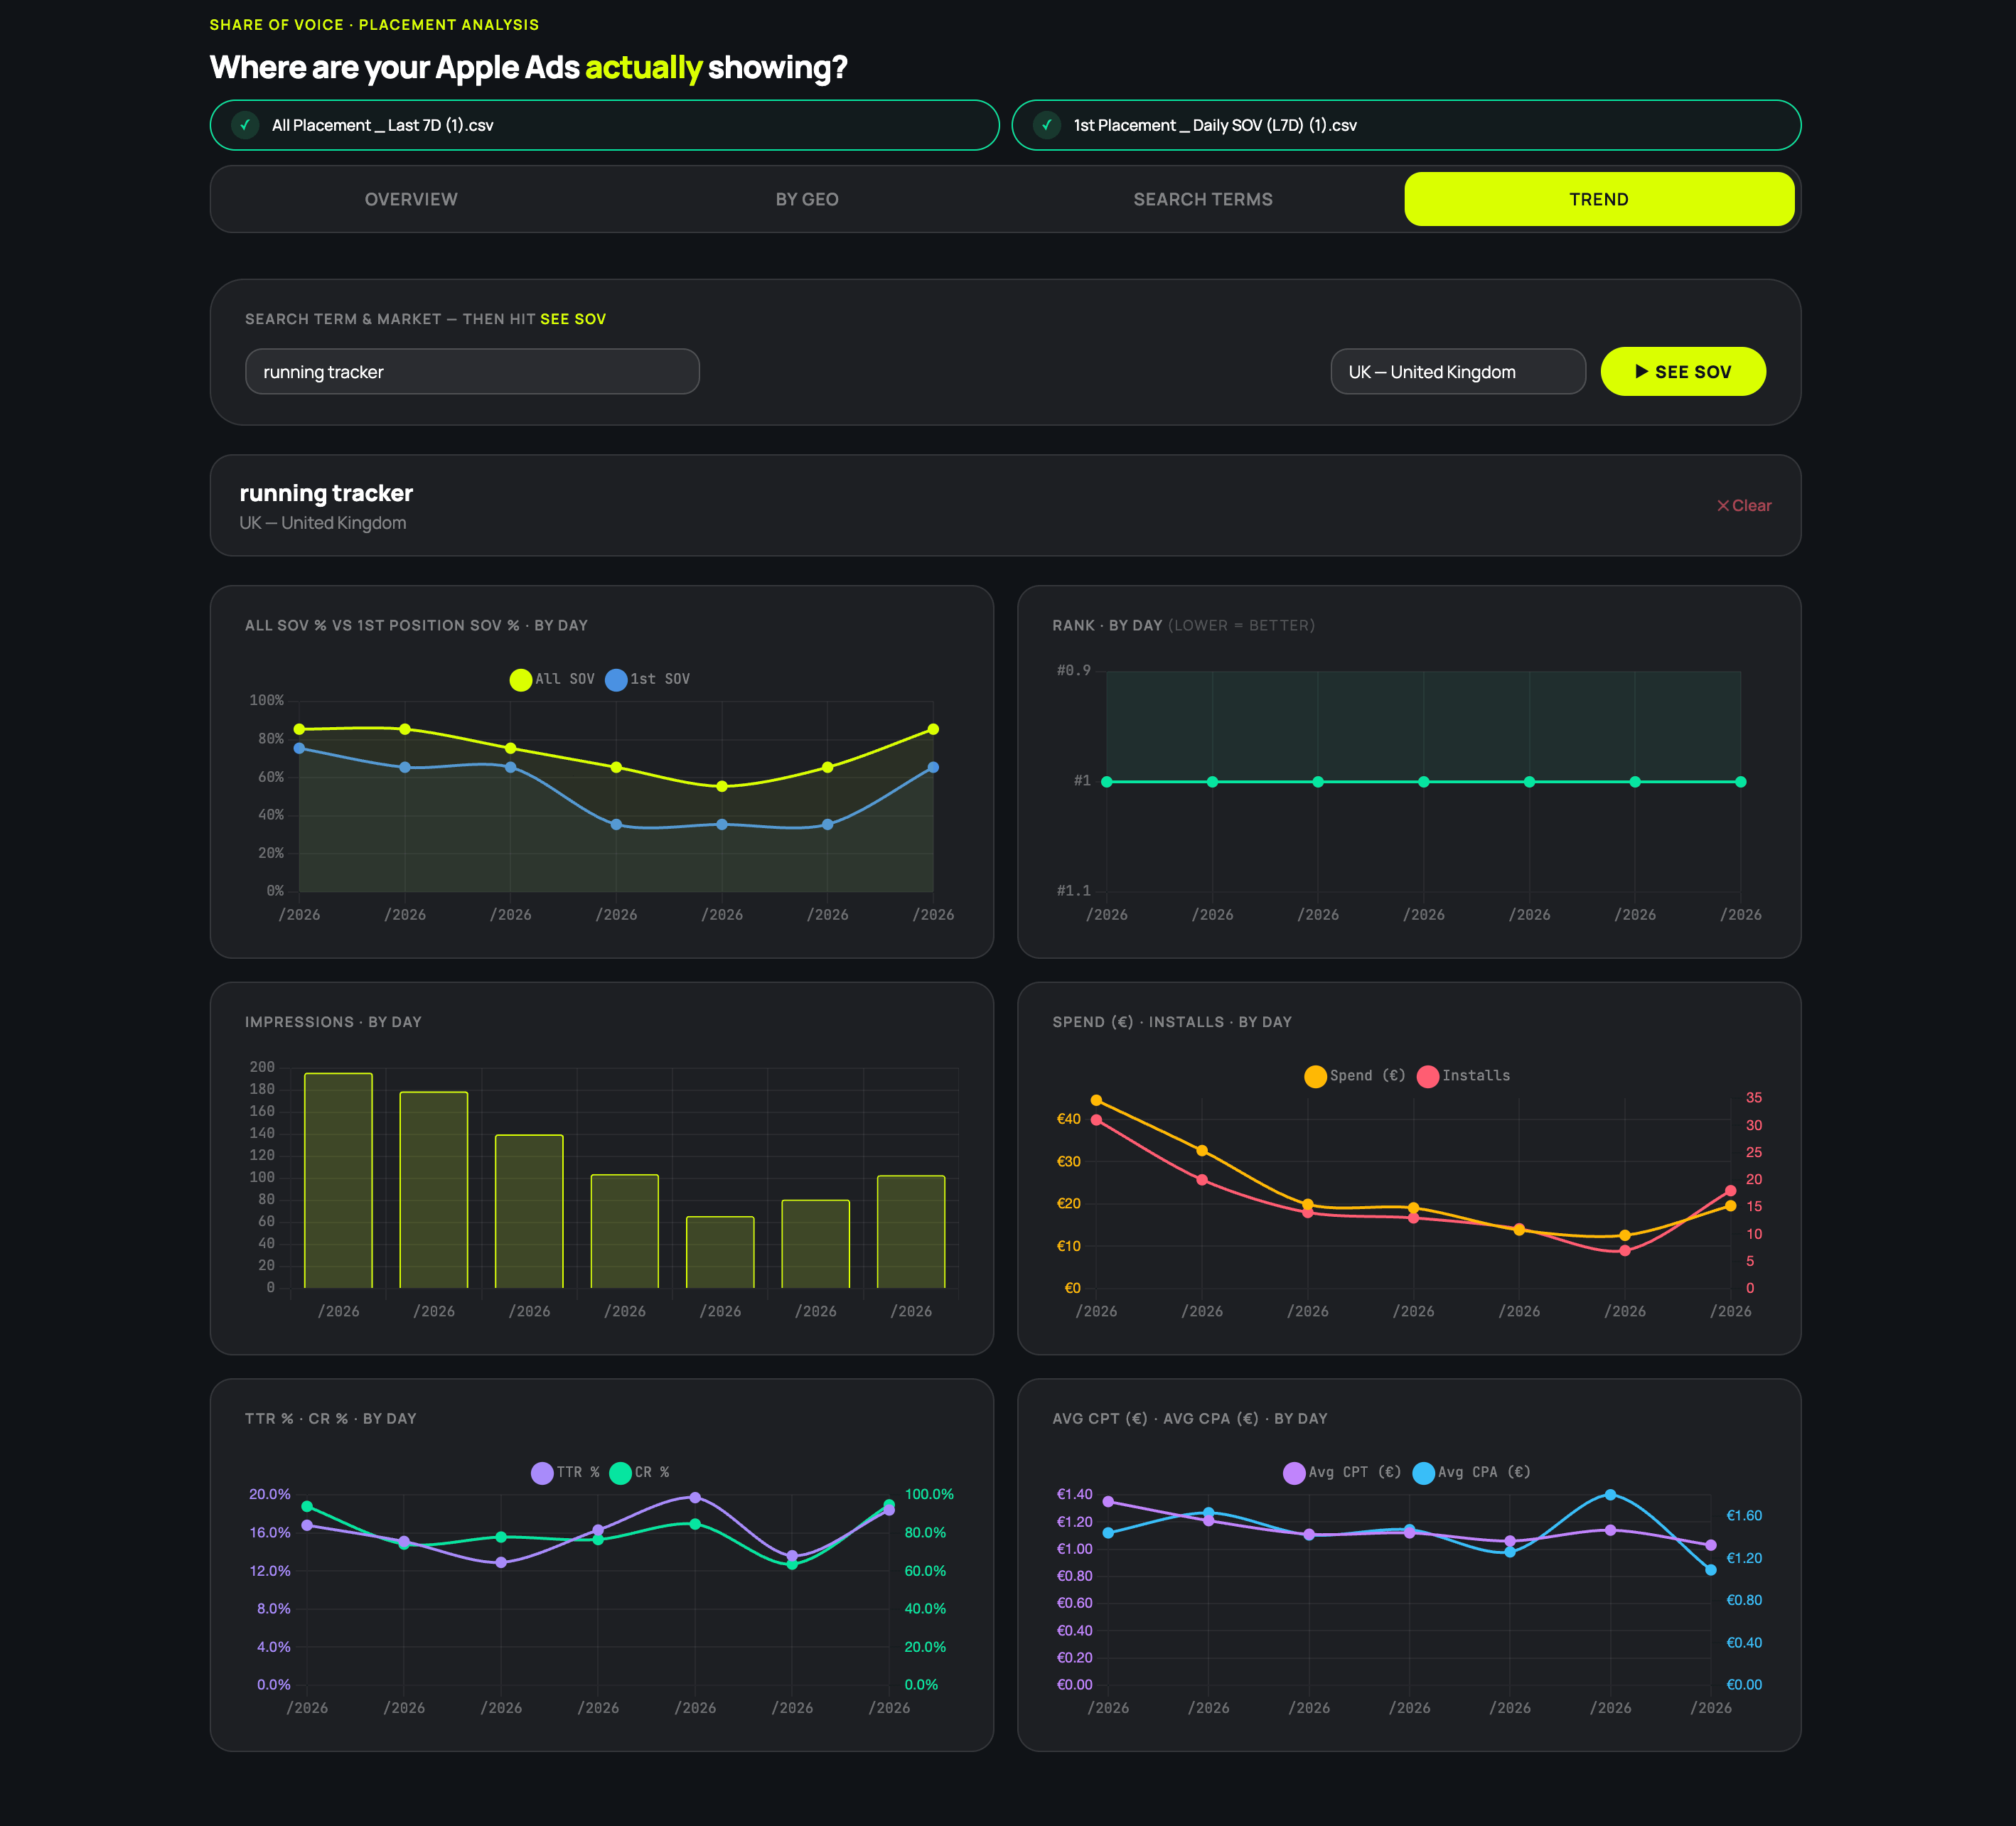
Trend : pick any keyword + geo and chart its SOV over time day by day
Why placement actually matters
Most Apple Ads practitioners optimise for impressions and installs. SOV is a layer deeper.
The difference between 1st position and 2nd position isn’t just impressions. It’s TTR, Conversion Rate, it’s whether you’re in the tap-zone or below the fold. On a phone screen, position matters more as there’s limited space, less attention, and the decision to tap happens in a fraction of a second.
When you run the SOV Analyzer on a real account, here’s how I think about what I’m seeing:
Brand keywords: if you decide to protect your brand name, aim for 80-90%+ 1st position SOV. Anything below that and you’re letting competitors show up on your own name.
Generic keywords: well, it depends. Even 5-10% SOV on a high-volume term can go a long way if the intent is right. My take: don’t chase the top generic at high SOV. Look at the longer tail with more intent, less competition, and you’ll often find better TTR and CR at a fraction of the bid.
Competitor keywords: this is where it gets interesting. Pull up the tool and look at who’s not protecting their brand. Some apps barely defend their own name, and that’s an opening where you can easily get first position. Competitor keywords aren’t always top performers on ROAS, but I’ve seen cases where pairing them with the right Custom Product Page (a “switching” angle, a direct comparison, a specific use case) pushed ROAS through the roof. Worth testing before writing the category off entirely.
It’s free and your data never leaves your browser
Since the second placement launched, I was looking for a way to track this change easily. Where does my ad appear? What kind of SOV am I getting on my top generic keywords? Are they showing first or second position?
Platforms like Splitmetrics launched their own tool, more advanced, with actual data on which competitor is showing against a specific keyword. That’s cool, but I’m not using Splitmetrics and it’s not a good reason to change my stack (yet!).
So I built my own. Everything runs locally, as a single HTML file. No backend, no database, no account. Your data don’t go anywhere.
If you want to be extra safe: there’s a download button on the tool page to save it as an HTML file and run it completely offline.
How to get the reports from Apple Ads
Quick guide if you haven’t exported these before:
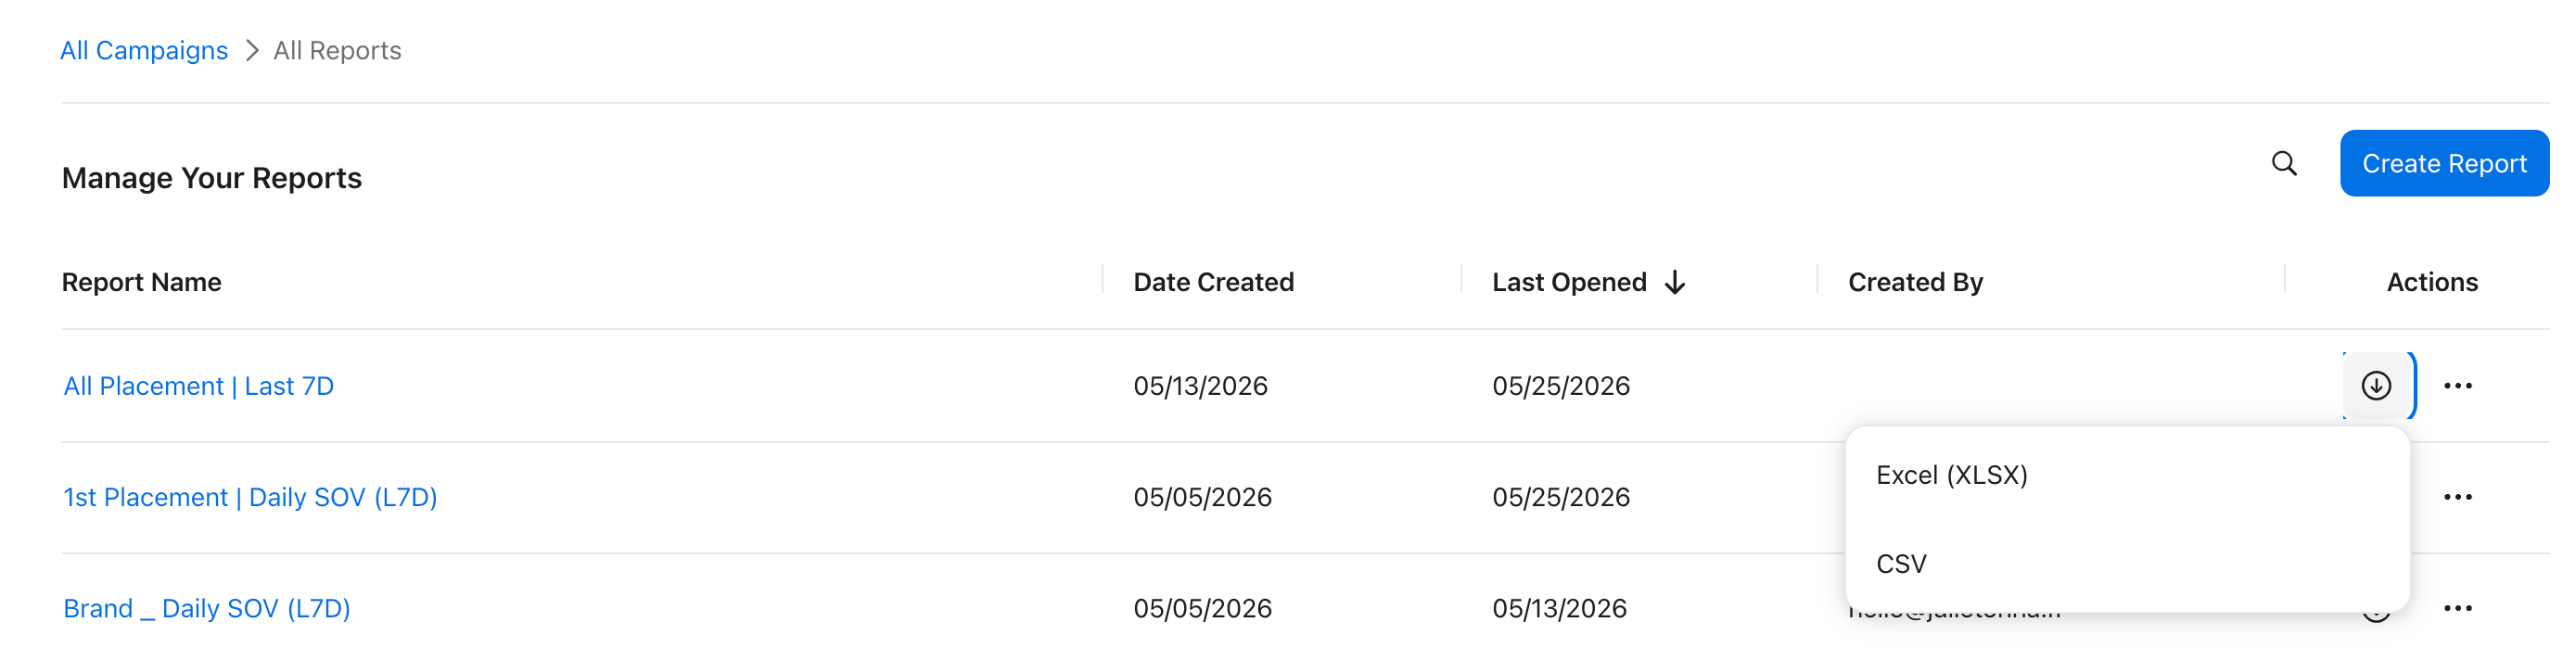
Go on ASA dashboard, and open Insights → Create new report
Template: Overview → Advanced → Daily Search Term Impression Share (All Ad Positions)
Set timeframe: Last 7 Days (or up to 30 days for a wider view)
Run → Download as CSV or Excel → Save the report for next time
Repeat for Daily Search Term Impression Share (First Ad Position)
Upload both files. That’s it.
You can also switch to Weekly reporting, and use a longer timeframe, up to 30 days.
What I find most useful in the tool
A few things that I really like and was always missing:
The overview position split. One bar chart that answers “how competitive are we actually?” with what percentage of your search term/geo combinations are 1st, Mixed, 2nd, or Low SOV. I see how this evolve across several weeks.
Top keywords by installs, spend, and impressions just below. This should be native in the Apple Ads dashboard imo. Seeing that your top spend keyword isn’t your top install keyword?
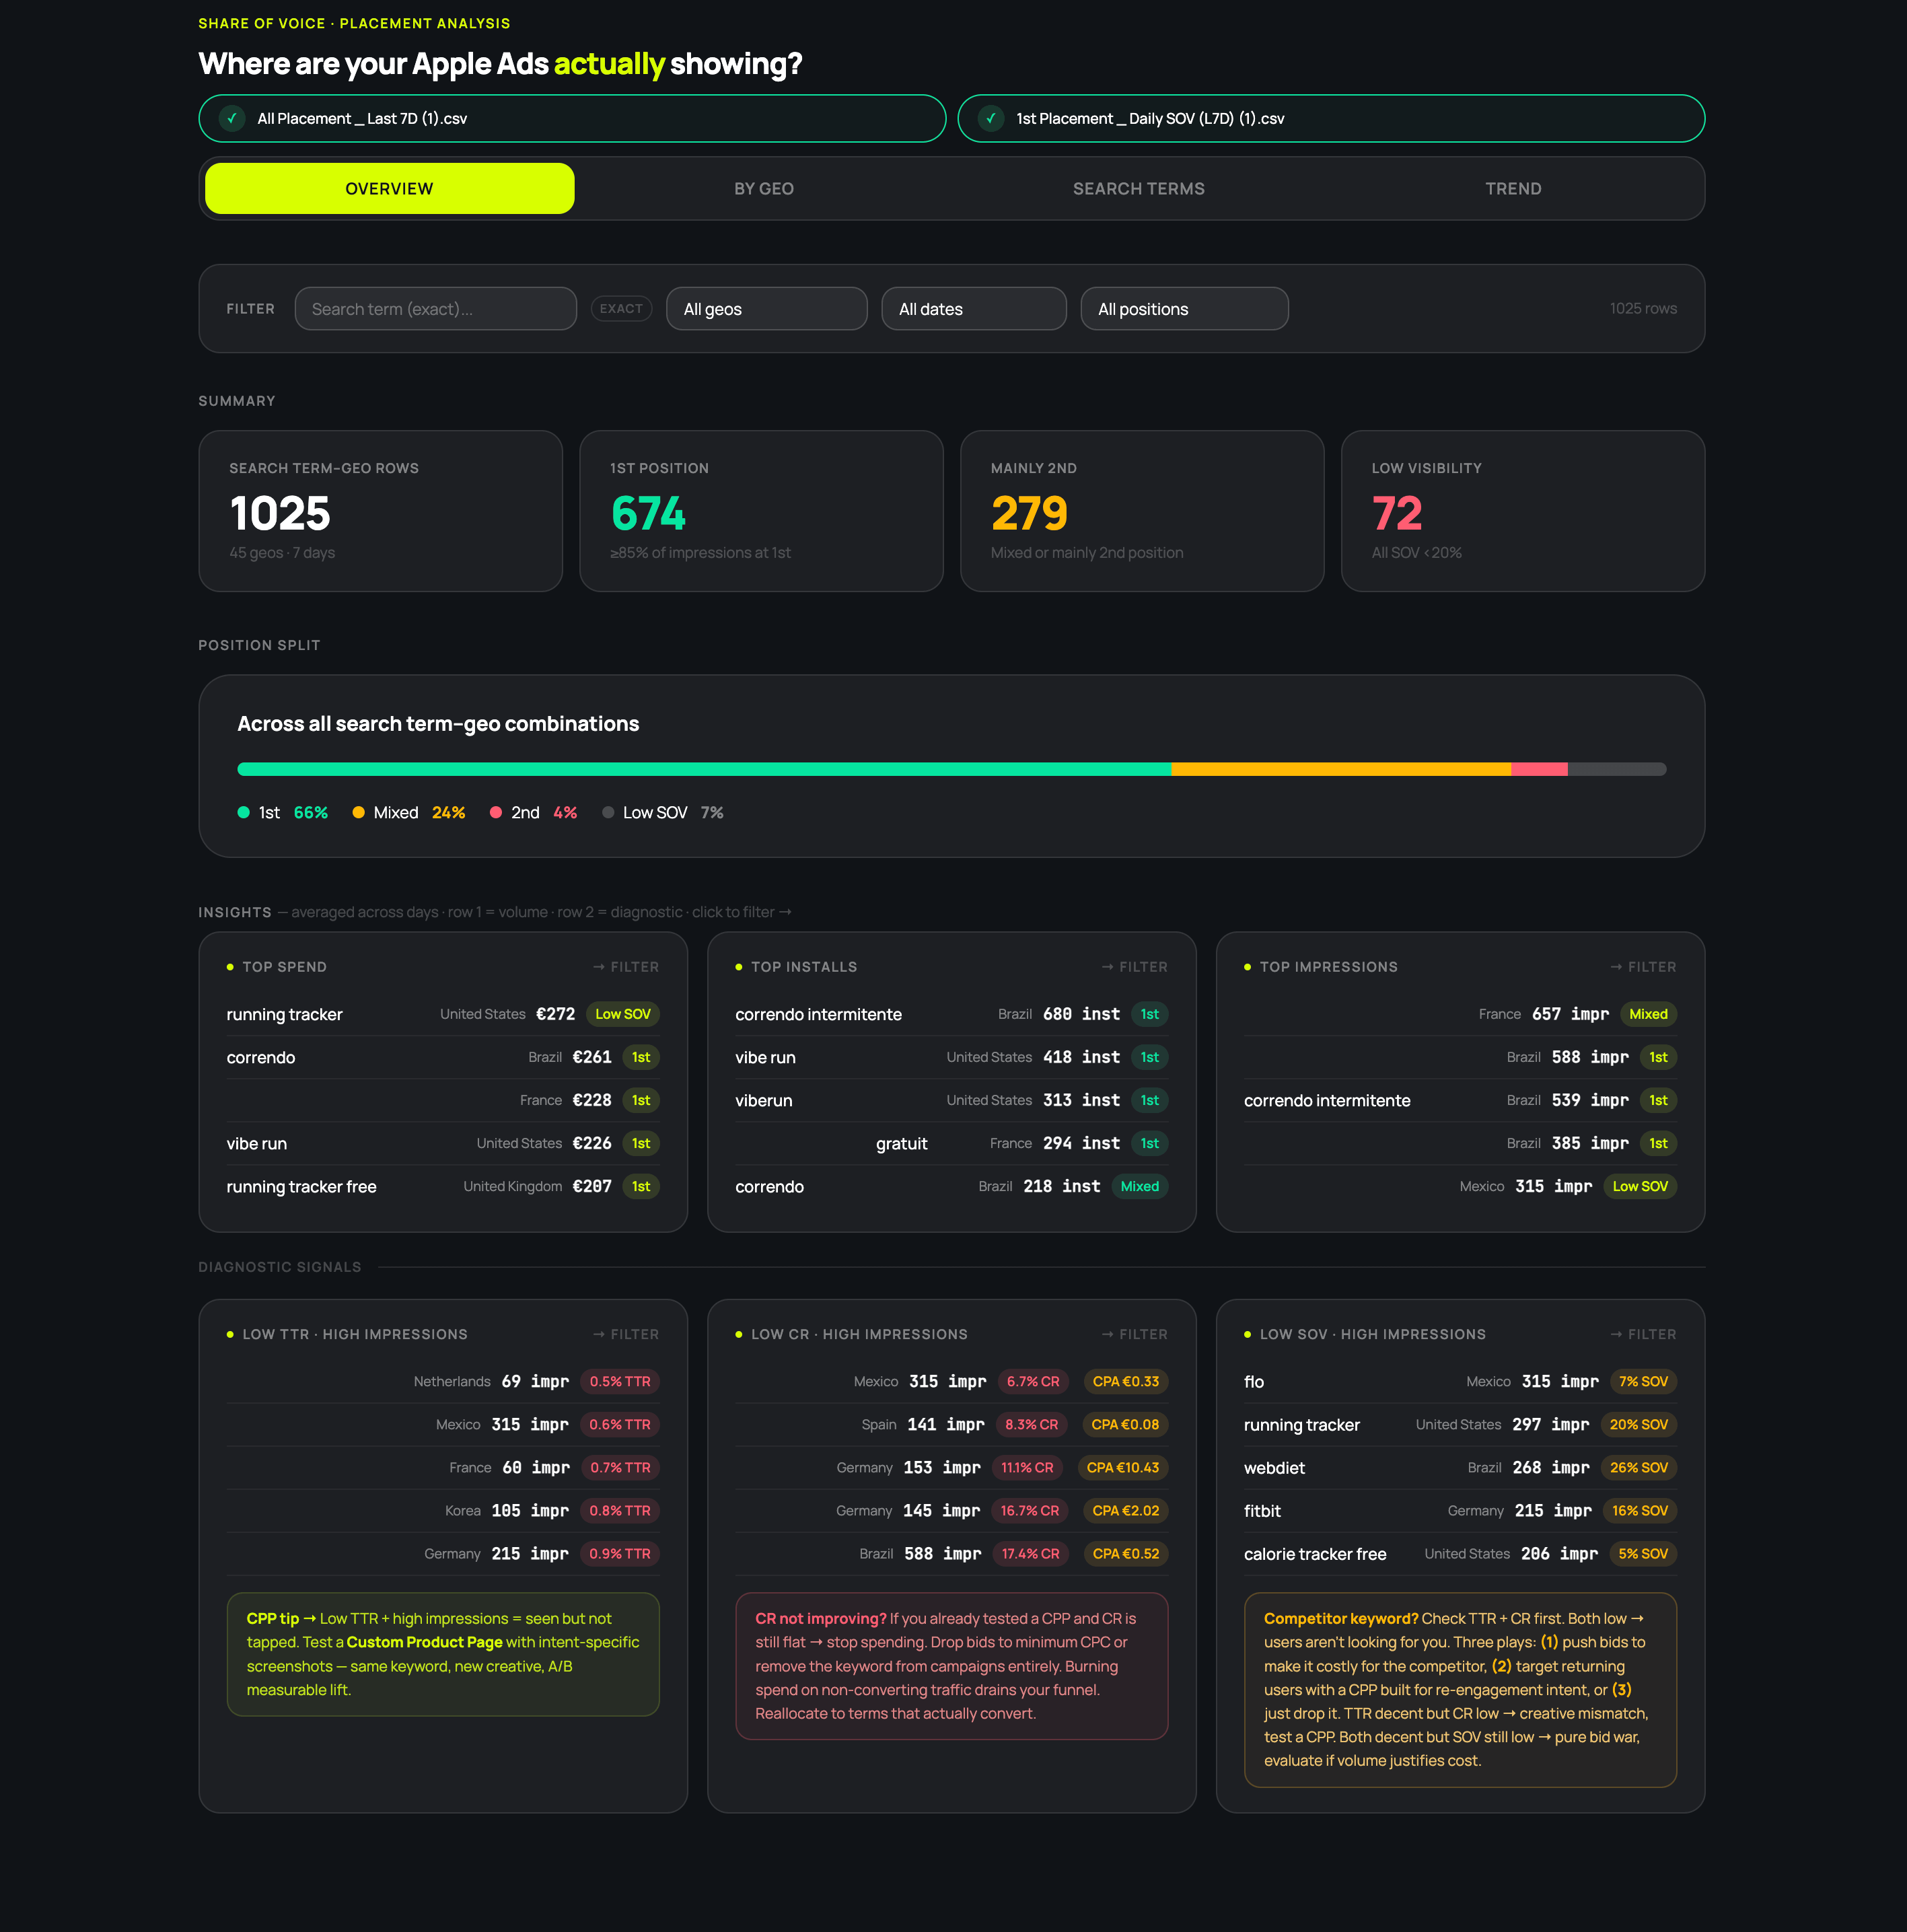
SOV by keyword across all geos at once. Filter for your brand keywords and see where you stand across every market in a single view. No pivot table, no separate sheets per country. Just: here’s your brand, here are your geos, here’s where you’re winning and where you’re exposed.
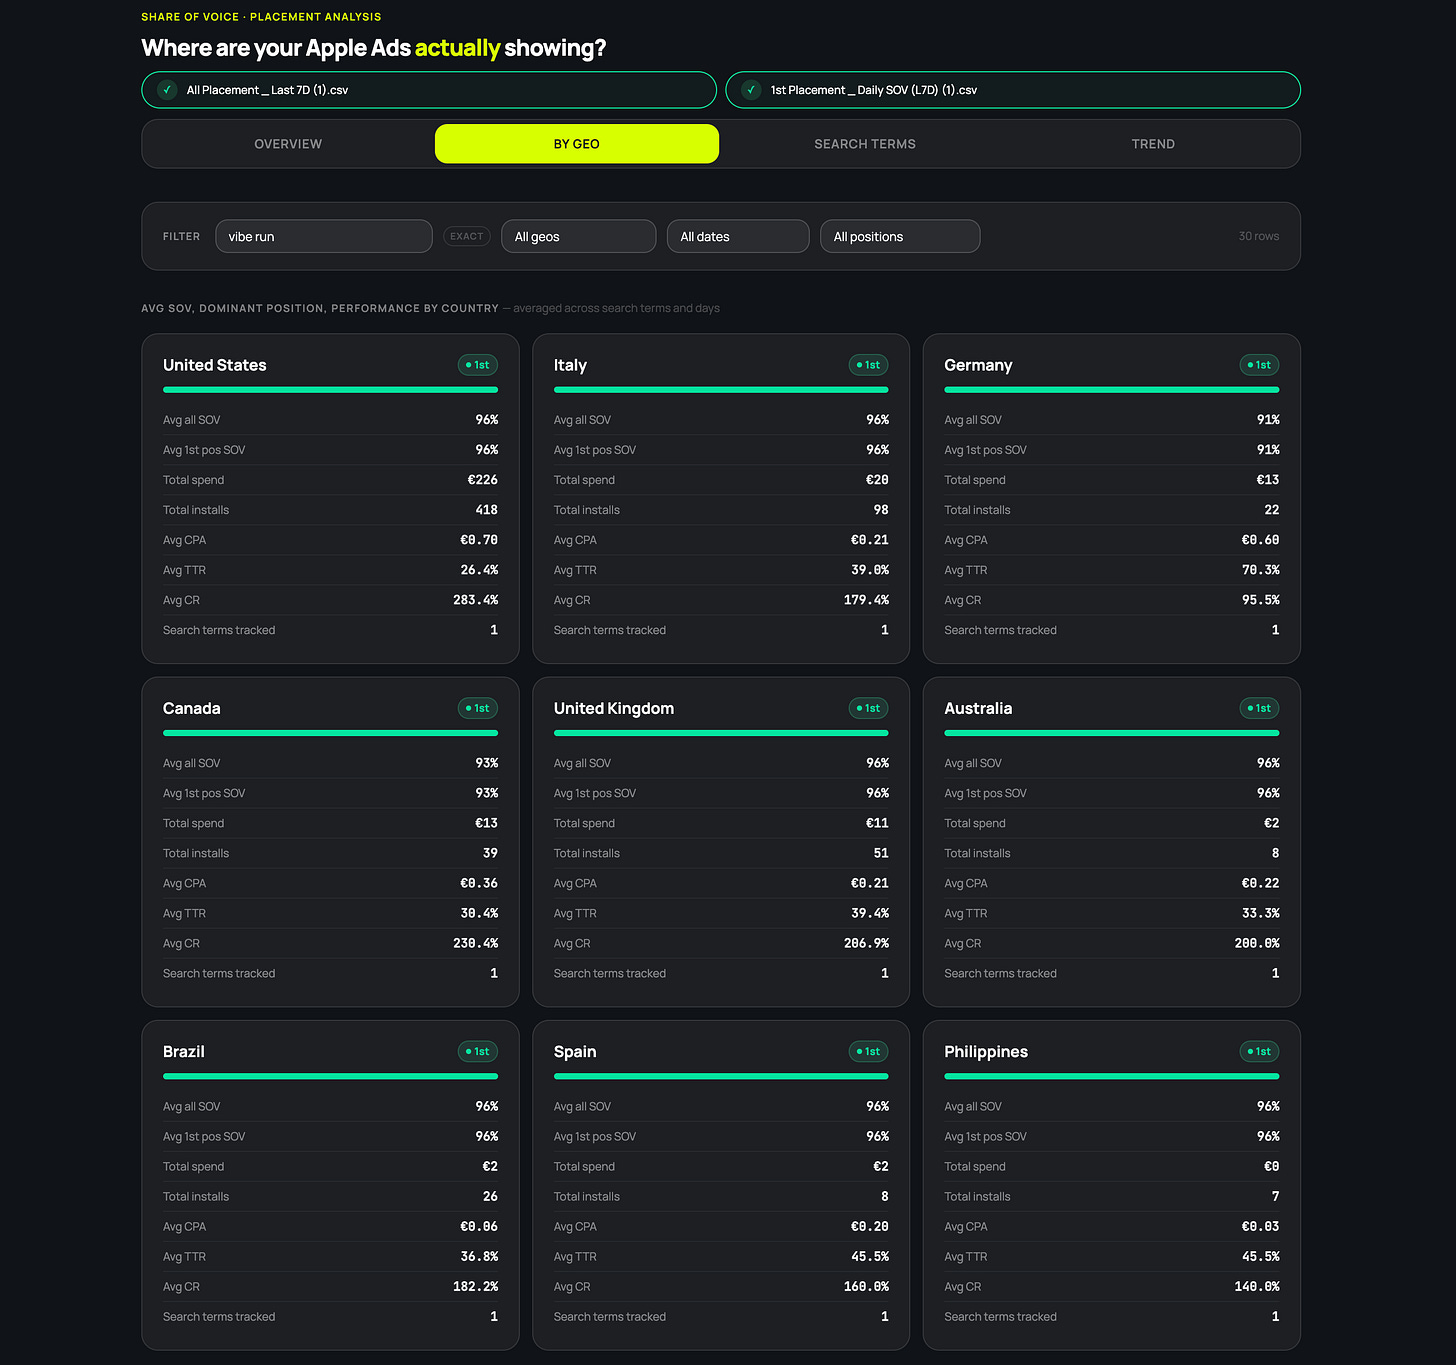
Looking at Brand SOV across geos Filtering search terms by ad position. This is where I find competitors who aren’t protecting their brand, or opportunities for generic kewyords where we’re mostly appearing in 2nd position, even with a high SOV. You can cross-check using Switchr to confirm which app is actually showing in 1st position in a specific geo - then use CPPs to align with their messaging.
The Trend tab is my favourite. Being able to see daily SOV split by position, the rank, impressions, installs, spend, TTR, CR, CPT, CPA all on the same tab for a single keyword/geo combination is chef’s kiss. You can literally watch how a keyword behaves over 7 days and see how all the metrics interconnect.
What’s next for the tool
Well… you tell me.
For me it’s already super useful. I use it weekly to check how keywords are doing and cross-check with AppsFlyer / post-install data to see if there’s room to scale. I might add some more insights on the Overview tab, and more filters to the Search term one.
If there’s something specific you’d want to see added, reply to this.
And I’m already working on the next tool. Stay tuned.
You’re getting this first
As a Neo Ads subscriber, you get access to this before anyone else. I’ll post publicly soon, but you get first dibs.
If this is useful, forward this email to a colleague who runs Apple Ads. The more people who use it, the more feedback I get, and the better it gets.
Built by Julie @ NeoAds - freelance Growth Consultant specialising in Apple Ads, ASO and CRO.
If someone forwarded this to you: subscribe here.